
How to forecast northern lights like a pro
A lot of people who come to Finnish Lapland hoping to see the northern lights unfortunately miss them. Often it’s sheer bad luck with cloud coverage ruining any chance of seeing them, but it can also be for silly reasons. I can’t tell you how many times I’ve walked down to the local go-to spot in Rovaniemi, Finnish Lapland for aurora watching because the indicators show that there’s about to be a face melting aurora soon, but there’s tourists walking back towards town because they’ve clearly given up already.
In almost every case where this happens, the people who miss the big northern lights shows aren’t aware that there are indicators which tell you that there are northern lights on the way.
To increase your odds of seeing the northern lights, it’s essential to understand these solar wind indicators and how they paint a picture of the potential auroras headed for our skies. The data for these indicators is primarily coming from satellites called DSCOVR and ACE which are about 1.5 million kilometres away from earth. Depending on the speed of the solar wind at the current moment, this usually gives us a 30 minute to 2 hour heads up of what aurora conditions we can expect to see.
First, let’s go through each indicator with example screenshots. Then we’ll go through some hypothetical scenarios where we analyse the indicators as if we’re currently standing under clear skies in Finnish Lapland waiting for aurora.
In this article, we’ll use screenshots from SpaceWeatherLive which is one of the most comprehensive free aurora forecasting apps. If you’re struggling to understand the indicators, I recommend Laplandauroraforecast.com which shows the indicators and explains in simple English what they mean in terms of potential aurora conditions.

@rather.chilly @aleksimonaghan
Solar wind speed
The speed of the solar wind is one of the most straightforward indicators to track when aurora hunting. The solar wind is a stream of charged particles that are constantly flowing from the sun towards Earth. A higher solar wind speed increases the likelihood of more spectacular aurora displays when combined with other favourable indicators explained in this chapter. Higher winder speed also means that the other data you see and the aurora conditions they represent will happen faster.
Typically, solar wind speeds range between 300 and 800 kilometres per second (km/s). While auroral displays can occur with lower wind speeds, more significant activity tends to happen when speeds exceed 500km/s. Similar to a car crash, the faster the crash, the bigger the explosion!
You’ll want to watch for sudden spikes in wind speed, especially if a CME (coronal mass ejection, big explosion on the sun which sends a mass of particles) or other solar event is involved, as these often precede stronger auroras.

The chart on the left shows the solar wind speed bouncing between 450-800km/sec. The sudden rise in speed from 500-750 could indicate the arrival of a CME and hopefully some excellent auroras.
The Earth line is modelled from the wind speed and shows what conditions you should expect to see on earth right now. The data is coming live from the DSCOVR or ACE satellite which is 1.5 million kilometres away from earth, so at 744km/sec it takes about 34 minutes for the latest solar wind readings to hopefully spark auroras on earth (1.5m / 744 / 60sec = 33.6mins)
Solar Wind Density
In addition to speed and direction, the density of the solar wind also plays a role in auroral activity. Solar wind density refers to the number of charged particles present in a given volume of solar wind, usually measured in particles per cubic centimeter (particles/cm³). Higher densities mean more particles which increase the chances of a brighter aurora.
Solar wind density typically ranges from 1 to 10 particles/cm³, but during periods of heightened activity, such as a CME, densities can spike significantly to 40 particles/cm³ or even higher. A density of 10 particles/cm³ or higher can enhance auroral activity, especially when accompanied by high wind speeds and a southward Bz. Even so, good aurora shows can still happen when the density doesn’t seem high at all such as 2 particles/cm³.

This is the density chart from the same moment as the solar wind speed chart above. Similarly to the solar wind speed chart, the density seems to be increasing at the same time as the solar wind is picking up in speed, another good sign that a CME is arriving.
The Bt Component of the Magnetic Field
The Bt represents the overall strength of the interplanetary magnetic field. A higher Bt value indicates that the magnetic field is more intense, which can enhance the potential for auroras, especially when combined witha negative Bz.
For a strong auroral display, you’ll want to look for values of 10 nT or higher, as this suggests a stronger magnetic field capable of driving significant geomagnetic activity. A high Bt combined with a negative Bz can create the ideal conditions for some outstanding auroras.
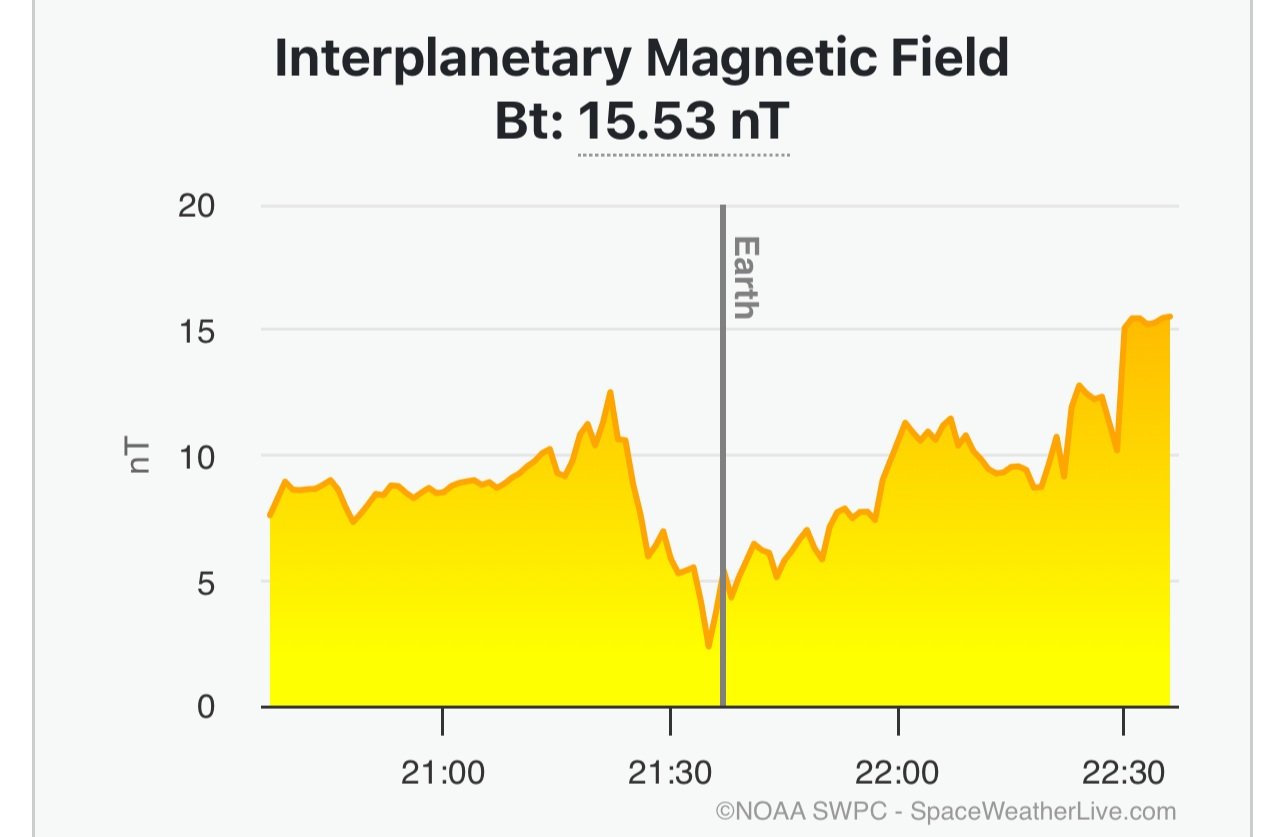
Here we see the Bt bouncing between 3 to 15. 3 is quite a low rating but it has been hovering around 10 which is quite good for Lapland. It has suddenly spiked up to 15 though which could mean something good is on the way. If the Bz (covered next) is negative, it looks there could be good auroral activity on the way.
The Bz Component of the Magnetic Field
Perhaps the most crucial factor to keep an eye on is the Bz component of the interplanetary magnetic field. The Bz component indicates the direction of the magnetic field relative to Earth. When the Bz is negative, it means that the magnetic field is pointing south, which is ideal for auroras. A negative Bz allows more charged particles to penetrate Earth's magnetosphere, resulting in stronger auroral activity. The more negative the Bz, the better the chances of seeing a vivid auroral display.
On the other hand, a positive Bz means the magnetic field is pointing north, which tends to suppress auroral activity. Even with a positive Bz, don’t be disheartened. Aurora seems to have a habit of appearing whenever she feels like it in Lapland, especially if the Bt is at a heightened level (+10).
Tracking the Bz component in real-time is crucial during aurora hunting, as the Bz value can fluctuate rapidly, sometimes changing in minutes. A strong southward Bz, especially below -5 nT (nanoteslas), combined with high solar wind speeds, is often a precursor to a fantastic aurora show.
The easiest way to think about the Bz and Bt, though it is maybe a bit misleading, is like a magnet. To ‘connect’, a magnet needs a negative charge and a positive charge. The Bt always has a positive value but needs a negative Bz value to result in auroras (in most cases). The higher the value of the Bt and the lower the value of the Bz will likely result in more and more spectacular auroras.

The Bz has been firmly positive for quite a while, but it has suddenly flipped to a strong negative. There’s likely no aurora at the moment, but there should be a great show coming within the next hour or two.
Kp Index
The Kp index is likely the most quoted indicator for understanding auroral activity, a shiny number that everyone likes to point to but most certainly not the best for predicting what is coming. If you hire an aurora guide who uses the Kp as their primary indicator for aurora activity, ask for your money back.
The Kp index is a measurement of geomagnetic disturbances on a scale from 0 to 9, with higher numbers indicating more intense geomagnetic storms. A value of Kp 5 or higher signals a geomagnetic storm, which can result in auroras visible even at lower latitudes. In high latitude areas such as Finnish Lapland, it is quite common to see auroras even when the Kp is at it’s lowest value, 1 or even 0.
The index is calculated by averaging measurements from ground based magnetometers spread across the globe, giving a broad sense of the overall geomagnetic activity in Earth’s magnetic field. While the Kp index is an indicator of potential auroral activity, it doesn’t always provide a real time picture of what’s happening in the sky at any given moment or what is coming. It reflects the overall intensity of geomagnetic storms over the previous three hour period. With that in mind, it can show whether conditions are generally favourable for auroras, but it doesn't necessarily paint a picture of what is coming.
Since it is a lagging indicator, the index can rise in value after intense auroras have already happened. This also means that the index could be low in value while intense auroras are happening in real time.
What can be of some use is Kp forecasts. These paint a picture of what we can possibly expect within the next few days. The sun has a 27 day rotation cycle which means that it is possible to estimate when particular sun spots will be facing earth, which can help give you an idea of what kind of aurora activity we could expect. It is important to note that these are just forecasts, and more than likely will not be accurate beyond 1-3 days into the future which is the average time that it takes particles from the sun to reach earth.
Let’s analyse some example scenarios you might face
There’s many different scenarios you may face when you are out hunting for northern lights so lets go through some examples and analyse what kind of northern lights conditions we can expect. In these examples, we’ll just be looking at the Bt and Bz which tell us almost everything we need to know when it comes to predicting auroral activity in Finnish Lapland.

If you ever want to trigger an aurora hunter, show them a screenshot like this. A decent Bt reading but Bz is firmly stuck in positive territory. There’s likely nothing at the moment and it doesn’t look like there will be anything coming in the near future. There are exceptions to this rule eg if there’s been a large solar storm the night before, there still could be auroras even with a positive Bz reading. In most cases though, there’s not going to be any activity with a reading like this.

This is quite a weak reading with the Bt slowly coming down from 6 to 4. The Bz is cascading between positive and negative, only getting down to around -3 for a short time period. The chart shows that we should have some faint auroras right now since the Bz is currently a little bit negative at the Earth line, but if not, we’ll wait around a little bit to see if we are able to see any faint activity in the next hour.

Looks like something decent is on the way. There has likely been some faint activity already, but something much better is on the way quite soon according to the Earth line. Bt is at 8 which is good but not at any kind of elevated level. Paired with a mild negative Bz, we could expect decent auroras soon but nothing too crazy.

Holy moly, you’ve probably just seen the most spectacular aurora show of your life and there is more coming shortly. Notice that the Earth Line is much closer to the right hand side so wind speed is very elevated. We also have a very strong Bt reading perfecty paired with a strong negative Bz reading. With elevated readings like this, aurora is likely to be seen all the way down in central Europe.